Above Photo: nivekhmng/Flickr
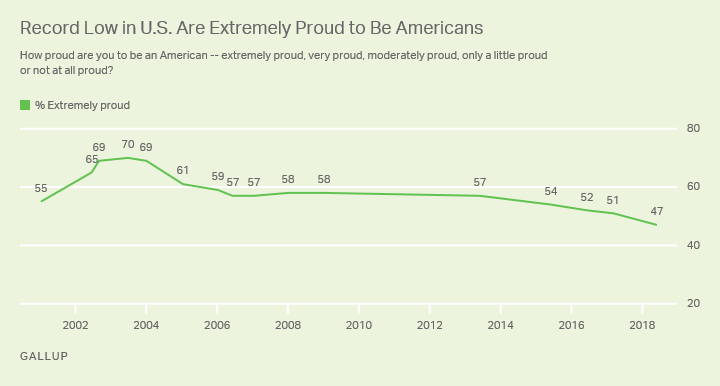
WASHINGTON, D.C. — This Fourth of July marks a low point in U.S. patriotism. For the first time in Gallup’s 18-year history asking U.S. adults how proud they are to be Americans, fewer than a majority say they are “extremely proud.” Currently, 47% describe themselves this way, down from 51% in 2017 and well below the peak of 70% in 2003.

The latest results are based on a June 1-13 poll. When Gallup first asked the question in 2001, 55% of Americans said they were extremely proud. After the 9/11 terror attacks caused the public to rally around the nation and its leaders, the percentage expressing extreme pride in the country increased to 65%, and went up further to 70% less than two years later.
By 2005, about the time George W. Bush was set to begin his second term in office and the U.S. was going on its second year of military involvement in Iraq, the percentage extremely proud to be Americans fell to 61%. It held in the high 50% range between 2006 and 2013, but has fallen at least marginally each year since 2015, about the time the 2016 presidential campaign was getting underway.
While the 47% who are extremely proud to be Americans is a new low, the vast majority of Americans do express some level of pride, including 25% who say they are “very proud” and 16% who are “moderately proud.” That leaves one in 10 who are “only a little” (7%) or “not at all” proud (3%).
The combined 72% who are extremely or very proud to be Americans is also the lowest in Gallup’s trend.
National Pride Dropping Most Among Democrats, Liberals
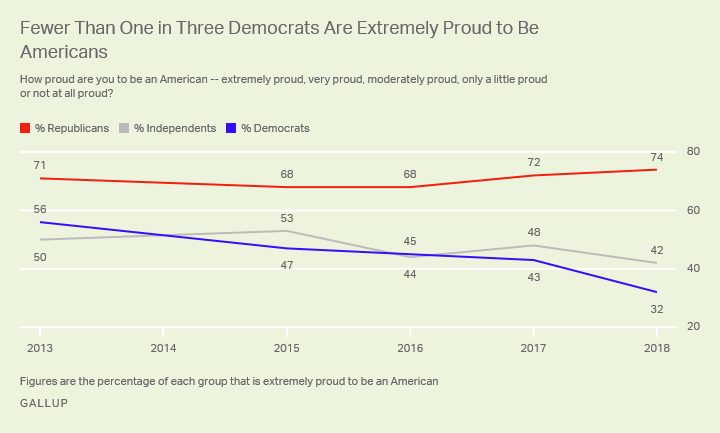
Currently, 32% of Democrats — down from 43% in 2017 and 56% in 2013 — are extremely proud. The decline preceded the election of Donald Trump but has accelerated in the past year.
Less than half of independents, 42%, are also extremely proud. That is down slightly from 48% a year ago, and 50% in 2013.
As has typically been the case, Republicans are more inclined to say they are extremely proud to be Americans than are Democrats and independents. Seventy-four percent of Republicans are extremely proud, which is numerically the highest over the last five years.

With the large decline among Democrats, the Republican-Democratic gap in extreme pride has grown from 15 percentage points in 2013 to 42 points today.
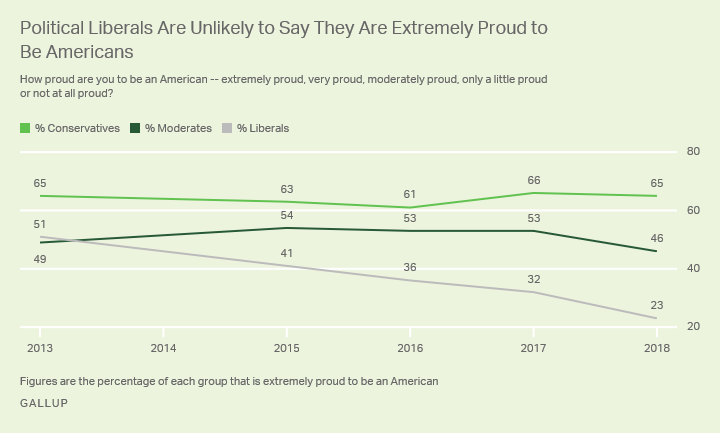
Political liberals are even less likely than Democrats to say they are extremely proud — just 23% do so, compared with 46% of moderates and 65% of conservatives. Extreme pride among liberals has dropped nine points in the past year and 28 points since 2013.

Other demographic differences in national pride largely reflect the political leanings of U.S. adults. Young adults, college graduates, nonwhites and women — all Democratic-leaning groups — are below the national average in terms of being extremely proud to be Americans. Meanwhile, older adults, those without a college degree, whites and men — who are more Republican-leaning — are above the average.
| 2013 | 2015 | 2016 | 2017 | 2018 | |||||||||||||||||||||||||||||||||||||||||||||||||||||||||||||||||||||||||||||||||||||||||||||||
|---|---|---|---|---|---|---|---|---|---|---|---|---|---|---|---|---|---|---|---|---|---|---|---|---|---|---|---|---|---|---|---|---|---|---|---|---|---|---|---|---|---|---|---|---|---|---|---|---|---|---|---|---|---|---|---|---|---|---|---|---|---|---|---|---|---|---|---|---|---|---|---|---|---|---|---|---|---|---|---|---|---|---|---|---|---|---|---|---|---|---|---|---|---|---|---|---|---|---|---|
| % | % | % | % | % | |||||||||||||||||||||||||||||||||||||||||||||||||||||||||||||||||||||||||||||||||||||||||||||||
| Men | 59 | 56 | 53 | 51 | 51 | ||||||||||||||||||||||||||||||||||||||||||||||||||||||||||||||||||||||||||||||||||||||||||||||
| Women | 55 | 52 | 50 | 51 | 44 | ||||||||||||||||||||||||||||||||||||||||||||||||||||||||||||||||||||||||||||||||||||||||||||||
| White | 61 | 58 | 54 | 55 | 54 | ||||||||||||||||||||||||||||||||||||||||||||||||||||||||||||||||||||||||||||||||||||||||||||||
| Nonwhite | 47 | 45 | 45 | 44 | 33 | ||||||||||||||||||||||||||||||||||||||||||||||||||||||||||||||||||||||||||||||||||||||||||||||
| 18 to 29 | 55 | 43 | 34 | 43 | 33 | ||||||||||||||||||||||||||||||||||||||||||||||||||||||||||||||||||||||||||||||||||||||||||||||
| 30 to 49 | 53 | 52 | 51 | 51 | 42 | ||||||||||||||||||||||||||||||||||||||||||||||||||||||||||||||||||||||||||||||||||||||||||||||
| 50 to 64 | 61 | 58 | 64 | 50 | 56 | ||||||||||||||||||||||||||||||||||||||||||||||||||||||||||||||||||||||||||||||||||||||||||||||
| 65 and older | 61 | 64 | 55 | 60 | 58 | ||||||||||||||||||||||||||||||||||||||||||||||||||||||||||||||||||||||||||||||||||||||||||||||
| College graduate | 53 | 51 | 47 | 47 | 39 | ||||||||||||||||||||||||||||||||||||||||||||||||||||||||||||||||||||||||||||||||||||||||||||||
| Noncollege graduate | 59 | 55 | 54 | 54 | 52 | ||||||||||||||||||||||||||||||||||||||||||||||||||||||||||||||||||||||||||||||||||||||||||||||
| GALLUP | |||||||||||||||||||||||||||||||||||||||||||||||||||||||||||||||||||||||||||||||||||||||||||||||||||
Most of these subgroups have seen declines in patriotism at some point over the last five years, with those declines greatest among nonwhites, young adults and college graduates.

Gallup News Alerts
Get the latest data-driven news delivered straight to your inbox.
Implications
Fewer than half of U.S. adults are extremely proud to be Americans, something that had not been seen in the prior 17 years Gallup has asked the public about its national pride. Politics appears to be a factor, with sharp declines evident among Democrats and political liberals and no decrease among Republicans and conservatives. Left-leaning groups’ antipathy toward Donald Trump and their belief that other countries look unfavorably on the president are likely factors in their decline in patriotism, particularly the sharp drops in the past year. But the declines began before Trump was elected.
National pride may be just one of a growing number of issues — including opinions about guns, labor unions and the environment — for which party loyalties are pushing Democrats and Republicans to adopt divergent views. These changes are making each party’s base more homogenous but increasingly different from one another.
SURVEY METHODS
Results for this Gallup poll are based on telephone interviews conducted June 1-13, 2018, with a random sample of 1,520 adults, aged 18 and older, living in all 50 U.S. states and the District of Columbia. For results based on the total sample of national adults, the margin of sampling error is ±3 percentage points at the 95% confidence level. All reported margins of sampling error include computed design effects for weighting.
Each sample of national adults includes a minimum quota of 70% cellphone respondents and 30% landline respondents, with additional minimum quotas by time zone within region. Landline and cellular telephone numbers are selected using random-digit-dial methods.
View survey methodology, complete question responses and trends.

