Above Photo: @AFL-CIO / Twitter.
Botched Policy Responses To Globalization Have Decimated Manufacturing Employment.
The Costs For Black, Brown, And Other Workers Of Color are often overlooked.
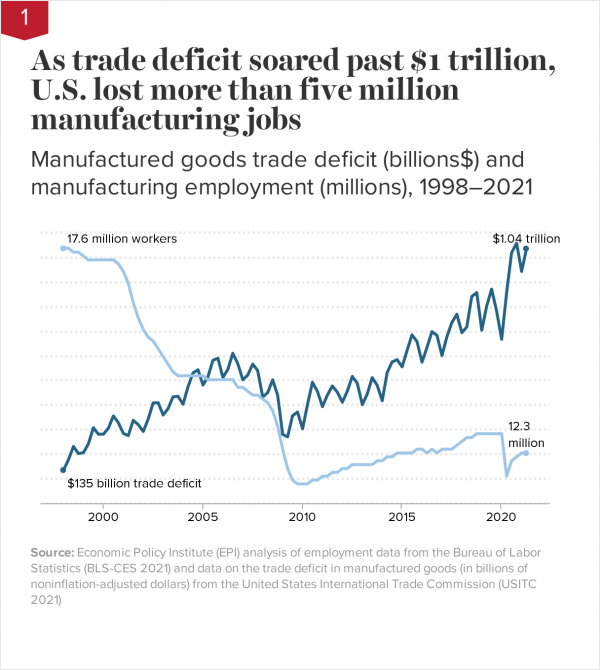
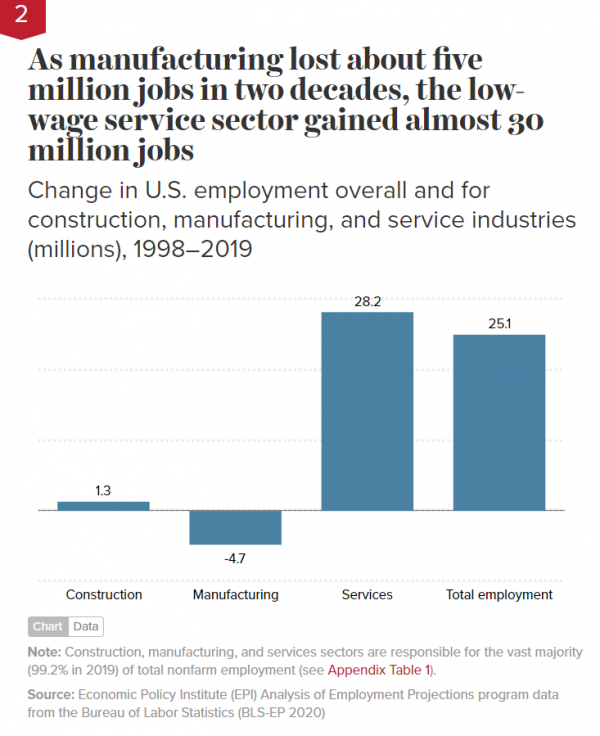
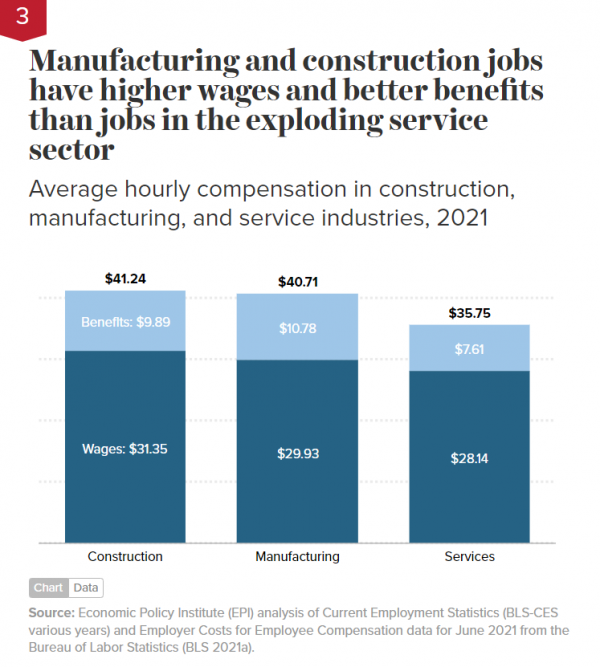
The mismanaged integration of the United States into the global economy has devastated U.S. manufacturing workers and their communities. Globalization of our economy, driven by unfair trade, failed trade and investment deals, and, most importantly, currency manipulation and systematic overvaluation of the U.S. dollar over the past two decades has resulted in growing trade deficits—the U.S. importing more than we export—that have eliminated more than five million U.S. manufacturing jobs and nearly 70,000 factories. These losses were accompanied by a shift toward lower-wage service-sector jobs with fewer benefits and lower rates of unionization than manufacturing jobs. The loss of jobs offering good wages and superior benefits for non-college-educated workers has narrowed a once viable pathway to the middle class.
This chartbook shows that the loss of manufacturing jobs has been particularly devastating for Black and Hispanic workers and other workers of color, who represent a disproportionate share of those without a college degree, and for whom discrimination has limited access to better-paying jobs. It calls for creating millions of good jobs for workers at every level of education by investing in infrastructure and rebalancing trade. When implemented with clearly defined racial and gender equity goals, these investments can help raise living standards for men and women workers of color without a college degree.
This chartbook comes at a crucial time. The bipartisan infrastructure bill signed into law in November, the Infrastructure Investment and Jobs Act (IIJA), invests about $550 billion in new federal funding for roads and bridges, railways, broadband, and other infrastructure. And an even larger social safety net and climate change bill awaiting a vote in the Senate—the Build Back Better Act (BBBA)—would invest roughly $2 trillion in child care, long-term care, universal pre-K, renewable energy, electric cars, and other human and climate infrastructure. But although these job-creating investments are welcome, they constitute just a down payment on a much larger agenda of investments needed over the coming decades to rebuild the American economy and complete the conversion to a zero-carbon, clean-energy future by 2050. And the current investments are already at risk: If steps are not taken to rebalance trade so that more of the goods consumed in the United States are made domestically, much of the new spending and new jobs will leak away to foreign suppliers. The threat is real: We continue as a country to import more than we export, and the surging imports mean that the reported U.S. trade deficit in manufactured goods for 2021 is likely to exceed $1.1 trillion.
Following Are Some Key Data Points In The Chartbook:
- Nearly 7 million jobs would be supported by a four-year, $2 trillion infrastructure and climate change investment program combined with trade and industrial policies that dramatically boost U.S. exports and eliminate the U.S. trade deficit. This includes at least three million good jobs (with high wages and benefits) in manufacturing and construction. If implemented with policies to help ensure that workers of color and women can access these jobs, this program would help reduce racial and gender inequities in the job market.
- Rebalancing trade, investing in infrastructure, and addressing climate change would help rebalance the economy back from lower-paying service- sector jobs to higher-paying jobs in manufacturing and construction. Essentially all of the net new jobs created in the economy over the last two decades were in services. In contrast, 45.7% of jobs supported by investing in climate and infrastructure and 40.8% of the jobs supported by rebalancing trade would be in manufacturing and construction.
- Supporting new manufacturing jobs is important for Black workers, who have been particularly hard hit by globalization and the decline in manufacturing employment. While Black workers’ share of total employment increased from 11.3% to 12.3% between 1998 and 2020, their share of manufacturing employment was essentially unchanged. Meanwhile, they experienced the loss of 646,500 good manufacturing jobs during that time period, a 30.4% decline in total Black manufacturing employment as part of the overall loss of more than 5 million manufacturing jobs between 1998 and 2020.
- Black, Hispanic, Asian American/Pacific Islander (AAPI), and white workers without a college degree all earn substantially more in manufacturing than in nonmanufacturing industries. For median-wage, non-college-educated employees, Black workers in manufacturing earn $5,000 more per year (17.9% more) than in nonmanufacturing industries; Hispanic workers earn $4,800 more per year (+17.8%); AAPI workers earn $4,000 more per year (+14.3%); and white workers earn $10,100 more per year (+29.0%). Manufacturing wage premiums are also substantially larger for all workers at the 10th percentile of the wage distribution.
- Surging imports from China and the resulting growing trade deficit with China have had a key role in manufacturing job loss. Reducing that deficit is critical to bringing jobs back. Between 2001, when China entered the World Trade Organization, and 2018, the growing bilateral trade deficit displaced 3.7 million U.S. jobs, including 2.8 million jobs in manufacturing.
- Historically, growing trade deficits have displaced a disproportionately large number of good jobs for workers of color. Between 2001 and 2011 alone, the growth of the trade deficit with China displaced 958,800 jobs held by workers of color—representing 35.0% of total jobs displaced by the growing trade deficit with China. About three-fourths of jobs displaced were manufacturing jobs, which feature high pay and excellent benefits.
- Growing trade deficits have hit workers of color in the pocketbook. In 2011 alone, workers of color displaced from higher-earning jobs in manufacturing and other traded industries into lower-earning jobs in nontraded industries earned $10,485 less in annual wages because of the growing trade deficit with China. This trade-related average annual wage loss per worker translates into a total loss of $10.4 billion per year for the 958,800 workers of color affected by growing trade deficits with China.
Policymakers Should Heed The Data On Globalization’s Impact And Boost Investment And Rebalance Trade
As the charts in this chartbook show, investments in infrastructure, domestic manufacturing capacity, and addressing climate change would create millions of good jobs for workers who have been hardest hit by globalization and the shift toward more low-wage service-sector jobs. The jobs created through these investments would offer better pay and benefits than average service industry jobs, with the potential to improve living standards for a broad group of racially and ethnically diverse, non-college-educated women and men.
At this writing, physical and human infrastructure investments approved or under debate in 2021, while welcome, are down payments on a much larger agenda of investments needed to rebuild the American economy and complete the conversion to a zero-carbon, clean-energy future by 2050. The job of rebuilding the American economy will not be completed in the first year of the Biden administration.
Policymakers must implement smart trade and industrial policies to maximize the jobs and benefits created by the current investments in infrastructure and clean energy and significantly boost those investments to match the scale of the need. These policies include aggressive and expanded use of Buy America programs, which should be applied to as much of new investments as possible. And any investments must be accompanied by substantial investments in research and development, training, and extension services, which will increase the supply of skilled workers for these good jobs and the competitiveness of U.S. manufacturing and construction industries.
These recommendations align with the Alliance for American Manufacturing’s American Manufacturing Plan, a plan calling for measures to increase domestic competitiveness, improve trade enforcement and trade agreements, and carefully shift the value of the dollar so that U.S. goods are competitive (Paul 2020). The recommendations also would operationalize the EPI policy agenda for trade, which states that we should “restore and protect American manufacturing by using policy levers to ensure that American manufacturers’ ability to compete on global markets is not hamstrung by a chronically overvalued dollar, as it has been for decades” (Economic Policy Institute 2018). Ways to realign the dollar and rebalance U.S. trade and capital flows are explained by Scott (2020a, 2020b).
This report shows the employment impact of infrastructure investments at the scale of the need combined with smart trade policies designed to eliminate the U.S. goods trade deficit with the rest of the world. Specifically, we illustrate the employment impacts of investing roughly $500 billion per year in climate and infrastructure over four years (as originally proposed by President Biden during his 2020 election campaign) and eliminating the U.S. goods trade deficit of $854.3 billion (which was projected to likely reach $1.1 trillion in 2021 according to the U.S Census Bureau (2021b)), which would dramatically increase demand for American-made manufactured goods. We draw on Scott, Mokhiber, and Perez (2020), which showed that these investments, and the increased spending on domestic goods, could support at least 6.9 million jobs over four years, including at least three million good direct and indirect jobs in manufacturing and construction. Rebalancing U.S. trade alone could support 3.5 million of those 6.9 million jobs, including 1.4 million good jobs in manufacturing and 44,000 good jobs in construction.
The investments called for are scaled to the need. Every four years, the American Society of Civil Engineers (ASCE) estimates the investment needed in each infrastructure category to maintain a state of good repair and earn a B grade. ASCE’s 2021 Infrastructure Report Card estimates that the U.S. infrastructure investment gap—how much less the U.S. will invest in its infrastructure than it needs to over the next decade—is $2.59 trillion (ASCE 2021). Since the recently enacted IIJA includes only $548 billion in new funding for both infrastructure and climate investments, and the bulk of the investments in the proposed Build Back Better Act (included in the reconciliation bill still being considered at this date) are for safety net and climate expenditures, with relative small and still-indeterminant amounts for infrastructure, it is clear that there will be substantial infrastructure needs remaining to be addressed during the balance of President Biden’s first term. Furthermore, even if President Biden’s full $6 trillion proposal to upgrade America’s physical and social infrastructure, first unveiled in June 2021, were eventually fully funded, much more is needed to meet our infrastructure needs and fully fund the transition to a zero-carbon economy over next 30 years (Tankersley 2021).
Future Research Should Focus On Women’s Access To Manufacturing And Construction Jobs
As the charts in this chartbook show, manufacturing and construction offer good jobs for women, but women make up a smaller share of total employment in these two industries (29.2% and 10.6%, respectively) than men. Women hold a disproportionately large (56.4%) share of service industry jobs—a notoriously low-paying sector—despite being less than half (48.8%) of the overall workforce (EPI 2021a). Women employed in manufacturing earn $183 more per week (22.2%) than women employed in service industries, on average, and women manufacturing workers earn much more than women workers in rapidly growing service industry subsectors such as restaurants and retail trade, where average weekly earnings are much lower than the overall average for service industries. (Data on average weekly earnings for all workers by industry are reported in Appendix Table 1.) Future research should explore ways in which public policies can help expand employment opportunities for women in high-wage manufacturing and construction industries. Boosting women workers’ share of higher-paying jobs would help close the persistent gender pay gap. Despite some narrowing of the gap, women workers overall are paid a lot less than men with comparable backgrounds. The regression-adjusted wage gap was 22.6% in 2019 (down slightly from 23.9% in 2000), meaning women were making 22.6% less than men with comparable backgrounds (that is, adjusting for differences in education, age, and region) (Gould 2020, Appendix Table 1).
A Quick Note About The Data And Definitions
The data in the charts and tables in this report are drawn from a number of sources, and specific sources are provided for each chart and table. This note provides a general introduction to the data and time periods covered in this analysis. For the broad overview of trends in employment, trade, and compensation by major industry, we use detailed historical data on employment by industry for 1998 to 2019 obtained from the Bureau of Labor Statistics Employment Projections program (BLS-EP 2020). These data were supplemented with monthly data from the BLS’s Current Employment Statistics (BLS-CES various years). Data on overall compensation, including wages and benefits shown in Chart 3, are from the BLS’s Employer Cost for Employee Compensation series (BLS 2021a).
All of the data in this report refer to the number of workers employed (that is, people with a job), so estimates of total employment are a measure of the total workforce. Workforce measures (as used here) are distinct from estimates of the domestic “labor force,” which are derived from the monthly household (CPS) surveys of employment, unemployment, and labor force participation rates. To provide a more comprehensive look at the economy, we did not restrict the sample to only those who are working full time.
We use industry-based definitions of employment in this study to break the economy into three basic types of jobs: construction, manufacturing, and services. These sectors are responsible for the vast majority (99.2% in 2019) of total nonfarm employment (estimated from Appendix Table 1 at the end of the report) in the United States, and for an even larger (99.8%) share of net job creation or destruction over the 1998–2019 period in the nonfarm economy (also derived from Appendix Table 1). In 2019, the construction industry employed about 7.5 million workers, or about 4.9% of total nonfarm employment of 151.7 million. While the number of construction workers has increased slightly over the past two decades (as shown in Appendix Table 1), the number and share of manufacturing workers has fallen steadily for the past two decades (Table 2 and Chart 2), to 12.8 million workers in 2019, or 8.5% of total nonfarm employment. The vast majority of all jobs in the economy are then included in the service industries, which employed 130.1 million workers in 2019, or 85.8% of total nonfarm employment. The service sector encompasses a broad set of industries ranging from very low-wage sectors such as retail trade, restaurants, and other segments of the hospitality industry—sectors dominated by minimum wage labor—to high-wage sectors dominated by professionals such as law, accounting, and financial services. But even large, relatively skill-intensive sectors such as health care include vast numbers of workers with less than a college degree (roughly half of total employment in this industry), and these health care workers have average earnings of less than $800 per week.
Data on average hourly wages and average weekly hours by industry, and head counts for different demographic and ethnic groups—shown in Charts 4 and 13 and Tables 1 through 3—were based on a pooled four-year sample of Current Population Survey (CPS) data covering the years 2017 to 2020 from EPI Microdata Extracts (EPI 2021a). Estimates of average hourly wages in real 2020 dollars (wages only, not including benefits), average weekly hours by industry, and head counts by demographic group were used to compute average weekly earnings. Those data were used to compare average weekly earnings by industry and demographic group in Charts 12 and 15, and Tables 1,2, and 3. Average weekly earnings in construction and manufacturing are higher than in the service industry both because hourly wages are higher and because workers in these industries are employed for more hours per week. Separately, benefits are substantially higher in manufacturing and construction than in services, as shown in Chart 3.
Broad estimates of annual earnings of manufacturing and nonmanufacturing workers by race and ethnicity, shown in Charts 6 and 7, were estimated using the March CPS Annual Earnings estimates file (also known as the Merged Outgoing Rotation Groups or CPS ORG), using a data set compiled by Flood et al. (2021). Estimates of union wage premiums in Chart 9 also use CPS ORG data but from EPI’s Current Population Survey Extracts (EPI 2021a), while benefit coverage for all workers in manufacturing, construction, and service industries, shown in Charts 10 and 11, were estimated with CPS Annual Social and Economic Supplement (SEC) data compiled by EPI (U.S. Census Bureau CPS-ASEC 2021).
Data on average weekly earnings by industry were combined with estimates of jobs supported by investments in infrastructure and clean energy and by rebalancing trade (Scott, Mokhiber, and Perez 2020) to estimate the average weekly earnings by race and ethnicity associated with these investments shown in Chart 15. The distribution of jobs supported by climate and infrastructure investments and by rebalancing trade are shown in Chart 14.
The demographic groups and breakdowns shown in these charts are broadly inclusive. They cover four major racial and ethnic categories: White, Black, Hispanic (to include Latina, Latino, Latine, and/or LatinX workers), and Asian American/Pacific Islander (abbreviated AAPI, which include indigenous and other Pacific Islanders) workers. These breakdowns are based on the EPI (2021b) Current Population Survey Extracts race/ethnicity variables, drawn from the CPS “wbhao” variable (white, Black, Hispanic, AAPI and other variable). (Results for “other” workers, who make up 1% of the sample, were excluded from these charts because of the small sample size, because this group includes workers from a wide variety of racial and ethnic backgrounds that do not self-identify as white, Black, Hispanic, or AAPI, and because of the high variability and low reliability of the results.)
Prior EPI research has shown that growing trade deficits with China displaced a disproportionately large number of good jobs for workers of color. Between 2001 and 2011 alone, the growth of the trade deficit with China displaced 958,800 jobs held by workers of color—representing 35.0% of total jobs displaced by the growing trade deficit with China. About three-fourths of jobs displaced were manufacturing jobs, which feature high pay and excellent benefits. As a result, in 2011 alone, those 958,800 workers of color displaced from higher-earning jobs in manufacturing and other traded industries into lower-earning jobs in nontraded industries earned $10,485 less in annual wages, which translates into a total loss of $10.1 billion per year.
Also not shown in the graph, the big shift toward service-sector jobs lowered average wages for all workers without a four-year college degree. First there is the composition effect; as the share of lower-wage service-sector work in the U.S. labor market increases, the average wage overall falls. In addition, growing competition with low-wage workers in countries such as China and Mexico also pulled down wages not just in manufacturing but for all workers with a similar skill set. As a result, earnings fall not only for manufacturing workers but for all workers without a college degree—by nearly $2,000 per year, according to one estimate. This wage suppression affected essentially all 100 million non-college-educated workers in the U.S. labor force in this period. As wages for workers without college degrees fall, the gap between their pay and the pay of college-educated workers grows. The college wage premium measures what college-educated workers make relative to those without a college degree. One study of the growth of the college wage premium from 1995 to 2011 found that the rapid growth of imports from China in that period explained more than half of the growth in the college wage premium, as described above.
For more on the China Shock, see Autor, Dorn, and Hanson 2016. For more on manufacturing job losses after the Great Recession, see Scott and Mokhiber 2020. For more on wage suppression of non-college-educated workers and its causes, see Bivens 2017, Scott 2015, and Bivens 2013b, and for the impacts of China trade on Black and Brown workers, see Scott 2013.
See Appendix Table 1 for employment change from 1998 to 2019 and mean wages for all 52 industries in the United States.
For more on the job-creating potential of a combined investment and trade rebalancing initiative, see Scott, Mokhiber, and Perez 2020.
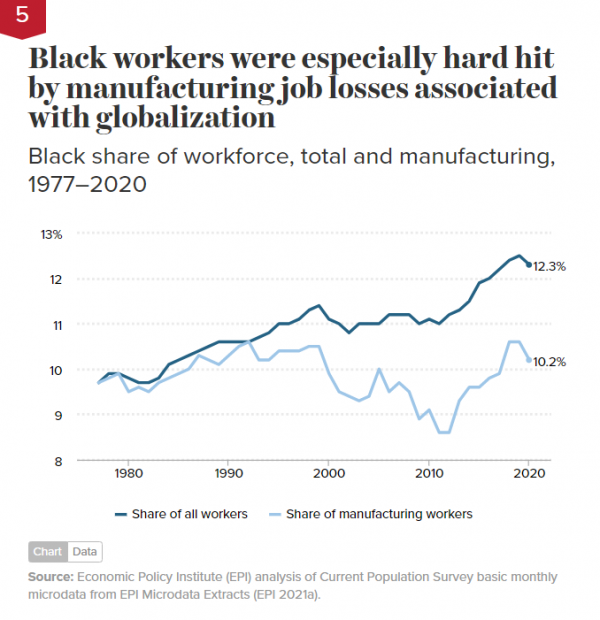
Though not shown in the graph, the increasing underrepresentation of Black workers in manufacturing jobs relative to their share of the workforce since the 1990s occurred alongside the shift of a substantial share of U.S. manufacturing employment to Southern states, where black workers accounted for a much larger share of the population relative to other regions of the country.
Given the workforce-share declines Black workers suffered in the 2001 recession, the Great Recession that began in 2007, and the COVID-19 recession, it is important that the rebuilding underway today include a focus on Black workers, who experienced disproportionately large job losses in the last three U.S. recessions.
Also not shown here but available in Appendix Table 3: The number and share of Hispanic and Asian American/Pacific Islander (AAPI) workers in manufacturing both rose rapidly over the past 20 years, in line with their dramatic rise in overall shares of the workforce. However, Hispanic workers make up a disproportionately large share (30.0%) of workers in the low-wage and high-risk meatpacking and other food manufacturing industries.
For more on the substantial share of U.S. manufacturing employment moving to Southern states, see BLS 2021c.
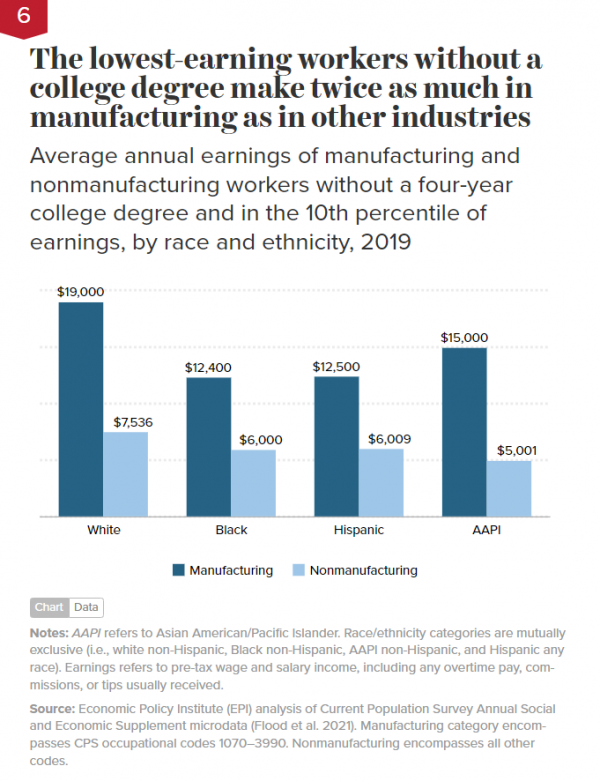
For more on how discrimination may appear in earnings differentials, see Wilson 2020.

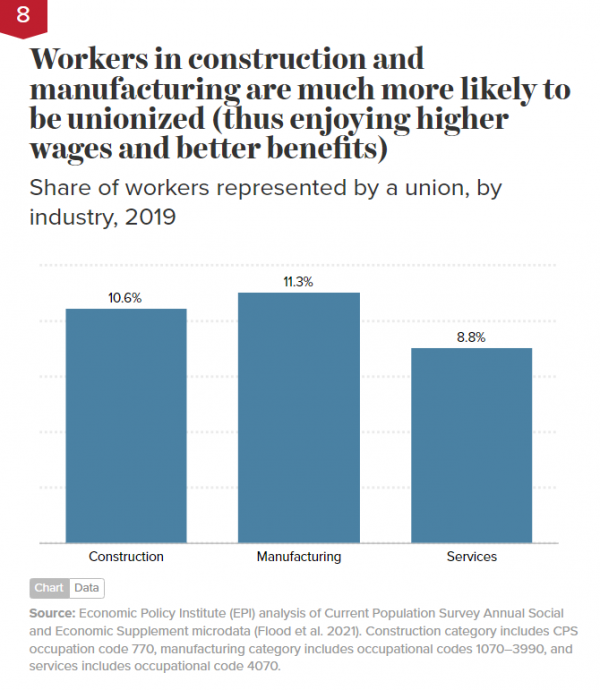
For more on how unions raise pay and improve benefits and reduce disparities, see EPI 2021c. For more on the benefits of unionization for workers of color and workers with lower incomes and less education, see Mishel 2021.

If the chart showed the overall union pay premium including benefits, the manufacturing and construction premiums would settle a little bit closer together because manufacturing workers get more in benefits than construction workers (as shown in Chart 3). But the gap would still be substantial.
Does unionization really offer a much bigger boost to construction workers than manufacturing workers? Yes, but the reason has little to do with unionization per se and much to do with globalization.
First, manufacturing workers must compete with low-wage workers in countries such as China, Mexico, South Korea, and Vietnam, meaning that even when in unions, they have much less bargaining power than construction workers, who do not face the competitive pressures from offshoring and unfair trade that make foreign goods and workers artificially cheap. Second, manufacturing work has been increasingly outsourced to less unionized staffing and temporary help services, which also puts substantial downward pressure on wages of U.S. manufacturing workers.
In short, the excess union wage premium in construction relative to manufacturing is another data point in support of the argument for investments and trade policies that bring manufacturing jobs back to the United States.
For more on the causes of unfair trade and how it artificially depresses wages of U.S. workers, see EPI 2018, Scott 2020a and 2020b, and Bivens 2013b and 2017. For more on the union status of the manufacturing temp help and staffing agencies, see BLS 2021b, and for more on increasing domestic outsourcing of manufacturing jobs to staffing firms, see Mishel 2018 and 2021. See Supplemental chart notes at the end of the charts for more details on the data.

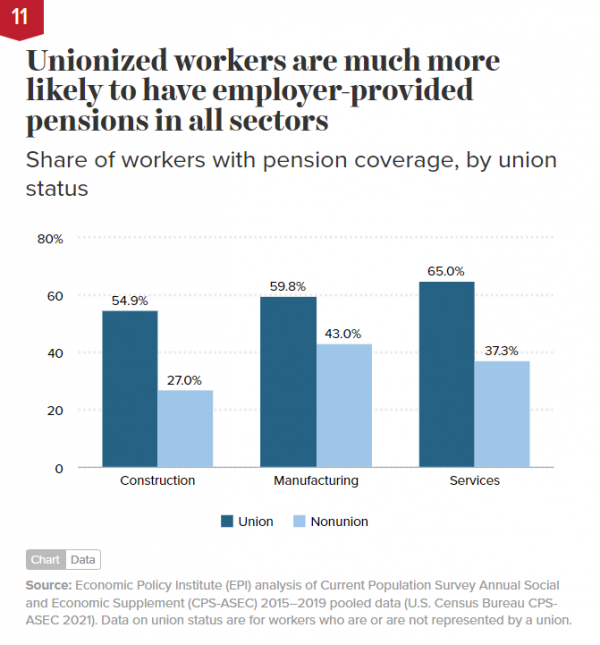
These data show another reason why an investment in and trade policies that support revitalizing manufacturing are critical to improving the lives of U.S. workers. By supporting the creation of more manufacturing jobs, more workers will have access to high-quality, company-provided health insurance, which will also reduce the demand for Medicaid and other forms of publicly subsidized health insurance, including American Care Act plans.

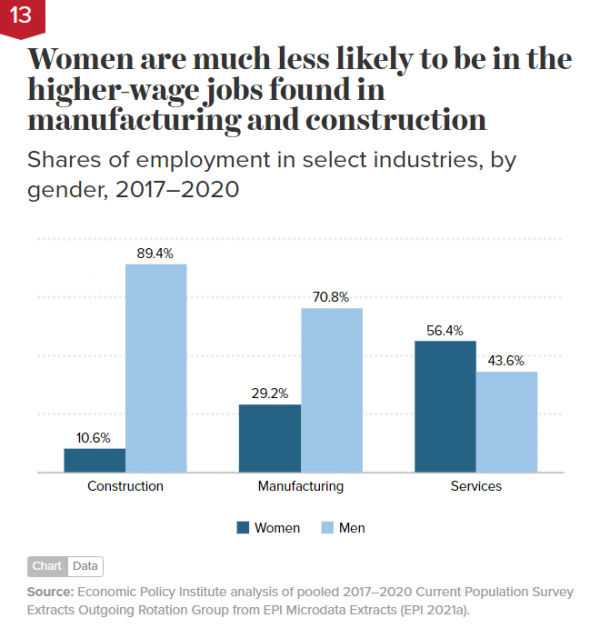
Women’s limited access to good jobs in manufacturing and construction contributes to the gender pay gap. Though not shown in the chart, past EPI research shows that on average, in 2019 women were paid 22.6% less than men with comparable backgrounds (that is, adjusting for differences in education, age/experience, and region of the country). Given the gender pay gap and the potential of manufacturing and construction employment to close that gap, gender equity should be considered alongside racial equity when developing and implementing public policies to create more good jobs in manufacturing and construction.
For more on the gender pay gap, see Appendix Table 1 in Gould 2020.
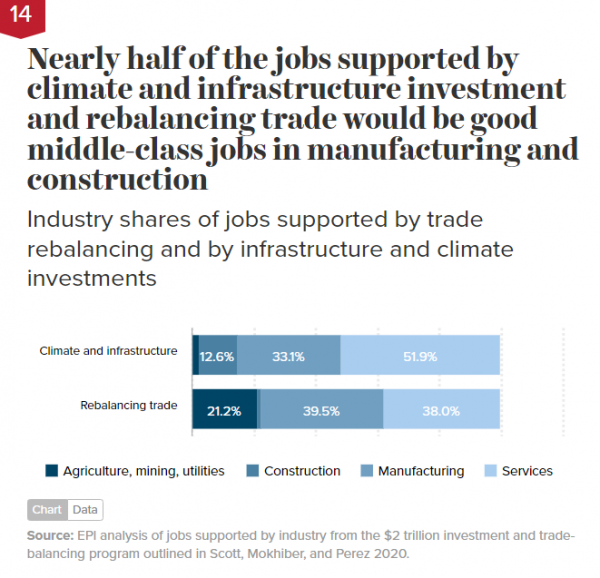
These estimates are based on EPI analysis in Scott, Mokhiber, and Perez 2020 of the job-creation potential of a two-pronged strategy for rebuilding the economy that includes $2 trillion of investments in infrastructure, clean energy, and energy-efficiency improvements over four years combined with trade and industrial policies that eliminate the U.S. trade deficit.
See Appendix Table 2 for an industry breakdown of jobs that would be supported by climate and infrastructure investments and rebalancing trade and average wages in those jobs.

Black workers in the new jobs supported by trade rebalancing and infrastructure and climate investment would earn roughly $100 per week more than in the service industry jobs, an earnings gain of 12.2% in jobs from new investments and 13.4% in trade rebalancing jobs. Hispanic workers would earn $145 to $149 more per week (from 19.9% to 20.4% more). Asian American/Pacific Islander workers would earn $93 to $166 per week more (from 8.3% to 14.7% more), and white workers would earn $146 to $212 more per week (from 14.4% to 20.8% more). Though not shown in the chart, gains in could push wages up throughout the economy. That’s because the types of jobs created by infrastructure and clean-energy investments and boosting U.S. exports include higher-paying manufacturing and construction jobs historically open to non-college-educated workers. Raising demand for these workers raises their pay. When combined with a strong emphasis on ensuring that Black, Hispanic, and other workers of color can access these jobs, the rebuilding plan would contribute to greater racial equity in the economy.
See Appendix Table 3 for an industry breakdown of the potential jobs gained, average earnings in those jobs, and the shares of jobs held by workers in different ethnic and racial groups. Detailed sectors that employ above-average shares of Black workers and/or other workers of color are bolded in the table.
Supplemental Chart Notes
Chart 1
As shown in Chart 2, the U.S. lost 4.7 million manufacturing jobs between 1998 and December 2019. Chart 1 extends the data through the first quarter of 2021, an additional 388,000 manufacturing jobs were lost, for a total loss of 5.1 million jobs (BLS-CES various years).
For readers familiar with our previous factory-loss estimates (more than 91,000 manufacturing establishments lost between 1997 and 2018, as reported in Scott 2020c), it is important to note that those estimates were based on earlier data from the U.S. Census Bureau’s Business Dynamic Statistics (BDS) through 2016, supplemented with County Business Patterns data on manufacturing establishment counts. Updated BDS statistics were released in September 2021 (U.S. Census Bureau 2021), which used NAICS-based industry definitions for the 1978–2019 period. The new NAICS-based establishment data reduced the total number of manufacturing plants by 23,2019 establishments in the base year of 1997 (a decline of 6.4%). The earlier BDS statistical series was based on a combination of Standing Industrial Classification (SIC) and NAICS (or census industry codes). In addition, the peak year in the number of manufacturing establishments in the 2021 BDS data occurred in 1998 (rather than 1997, as in the earlier data series). As a result of these changes and adjustments in industry coverage, the overall loss of manufacturing establishments between 1998 and 2019 declines to slightly less than 70,000 total establishments (from 91,000 in our earlier estimates). The switch from SIC- to NAICS-based industry definitions moved about 500,000 workers (and an unknown number of establishments) from manufacturing into service industries, in part through reclassification of contract manufacturing into the service sector.
Our colleague Josh Bivens points out that failure by U.S. policymakers to ensure U.S. competitiveness abroad was not the only thing that suppressed demand for U.S. exports over the past two decades. Japan and the European Union did too little to support their own economic growth in the early 2000s and in the wake of the Great Recession, and their resulting slow aggregate demand growth suppressed potential demand for U.S. exports (see Bivens 2013a).
Finally, it is important to note that workers employed by staffing agencies, which subcontract workers to manufacturing establishments, are not counted as part of manufacturing employment in the BLS establishment surveys. Thus, about 11% of the decline in manufacturing employment shown in Chart 1 is explained by the rising numbers of workers paid by staffing and other temporary-help agencies that work in manufacturing establishments. These workers typically receive much lower pay and benefits than workers directly employed by manufacturing firms (Mishel 2018, Table 6).
Chart 9
The chart reports the coefficient on union status from a regression of the log of the hourly wage on union status and a quintic polynomial in age (used as a measure of experience), and it uses dummies for race and ethnicity, education, citizenship, major industry, major occupation, state, and year. We exclude observations with imputed wages because the imputation process does not take union status into account and therefore biases the union premium toward zero. This analysis does not account for nonwage benefits.
To understand why wage premiums are larger in construction than in manufacturing, several factors should be considered. First, the charts only reports hourly wage premiums (excluding benefits). As shown in Chart 3, the average hourly value of employer-provided benefits in manufacturing ($10.78) is greater than those in construction ($9.89). The higher dollar value of nonwage benefits would compensate manufacturing workers for relatively lower wage premiums in manufacturing.
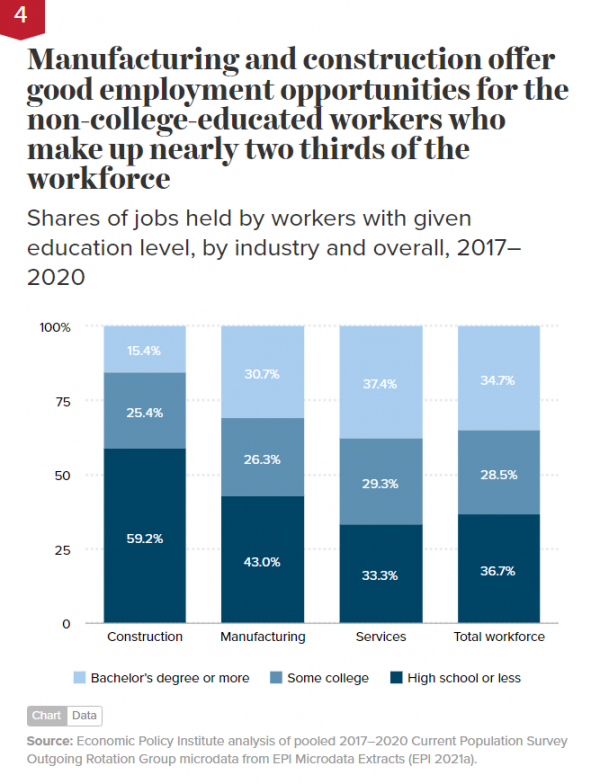
On the other hand, the construction industry employs a much larger share of workers with a high school diploma or less than the manufacturing industry (59.2% versus 43.0%, respectively) as shown in Chart 4, and yet the union wage premium in construction is clearly higher than in manufacturing, as shown in Chart 9. Thus, the fact that the wage premium for construction workers is larger than in manufacturing is particularly remarkable, since the wage premium for workers with a high school diploma or less would otherwise tend to be much smaller than that of a more educated pool of workers, such as manufacturing workers. Thus, something else is clearly sheltering construction workers from the competitive pressures felt by workers in manufacturing. Workers with a high school diploma or less would earn much less in service industry jobs, where two thirds of workers have higher levels of education (Chart 4, above), than they do in either manufacturing or construction.
Exposure to international competition is clearly the most important factor exerting downward pressure on manufacturing wages. While construction workers are largely insulated from competition with low-wage workers in other countries, manufacturing workers are directly exposed to international competition, via massive and rapidly growing imports of manufactured goods from low-wage countries such as China, Vietnam, and Mexico. Total goods imports, which are dominated by trade in manufacturers, will reach nearly $2.9 trillion in 2021, an increase of 21.9% over import levels in 2020. Unfair foreign trade policies—along with currency manipulation and excessive foreign capital inflows, which together are responsible for the 25% to 30% overvaluation of the U.S. dollar—are the most important causes of soaring imports and U.S. goods trade deficits. In addition to boosting the cost of U.S. exports, an overvalued dollar makes the wages of foreign workers artificially cheap and increases the cost of U.S. labor relative to workers in countries with undervalued currencies. See EPI 2018, Scott 2020a, and Scott 2020b for more; this section is based on EPI analysis of U.S. Census Bureau 2021b.

